In case you missed it, this final article (part 2 of 2) in the Investigator Spotlight Series, developed and written by Dr. Dawn Hayward, Office Clinical Cancer Proteomic Research (OCCPR) NCI Communications Fellow, highlights our up and coming Clinical Proteomic Tumor Analysis Consortium (CPTAC) researchers and their work. Part 2 features scientists from CPTAC’s Proteogenomic Data Analysis Centers (PGDACs). Find out more about the interesting and unique tools that are being developed and implemented by this up-and-coming crew of rising stars! Responses edited for length and clarity.
Matthew Wyczalkowski, Ph.D.
Instructor of Medicine in the Division of Oncology at Washington University at St. Louis with Dr. Li Ding's group, where he also earned his Ph.D. in Biomedical Engineering. He focuses on genomic analysis of CPTAC projects.
Investigator Spotlight (IS):  One of your responsibilities is to manage genomic analysis in CPTAC projects. How do you achieve this and what projects are you working on?
Matthew Wyczalkowski (MW): We provide the CPTAC research community with a variety of genomic analyses. These are standardized computational pipelines which analyze DNA and RNA sequencing data to obtain copy number, expression and mutational information. We work with consortium members to prioritize cases within a cancer type, identify and download the genomic data needed, and run a suite of analysis programs. We then collect and organize these results, upload them to the DCC (Data Coordinating Center) and create catalogs for easy access.
While straightforward enough, the amount of data is most challenging. In its first two years the CPTAC consortium generated over 600 terabytes of data. Over the years we’ve developed tools to automate much of the analytics while maintaining flexibility to incorporate new analyses and additional projects. As an example, we’ve revamped how we present our results including upgrading our workflows to run in high performance cloud environments. From our efforts we’ve provided a solid foundation to support the consortium’s cutting-edge research.
IS: What got you interested in data visualization and what tools have you developed to aid the broader scientific community in understanding CPTAC data?
MW: Data visualization is like photography where a good photo distills a complex reality into a single, clear frame. I’ve been interested in photography for years and one of my main specialties is creating figures and illustrations to tell compelling science stories for manuscripts and grants. Early on, my projects were motivated by a data visualization task: I developed a novel way of visualizing chromosomal translocations, creating computational pipelines to illustrate such events and interpret their structure. One pipeline called Breakpoint Surveyor was applicable to the tools which underlie many CPTAC genomic analyses.
IS: You’re a big proponent of bike safety. Why is it important to have bicycle infrastructure in place?
MW: I’ve been a bike rider my whole life and raced competitively in college. I still ride my bike to work and love it; it’s everyday exercise, keeps a car off the road and feels great. Encouraging more people to ride would be good for them and the community but many don’t feel safe doing it. Several years ago I founded SafeTGA.org to promote bike and pedestrian safety along my commute, one of the busiest cycling routes in St. Louis. Working with community organizations, city officials and the public we fought for and won bicycle infrastructure along the route. Recently I’ve been working with The BALSA Foundation which is focused on minority and immigrant entrepreneurship. This taught me that the skills I’ve developed as a scientist—analysis of problems, clear communication and commitment to a goal—are invaluable to civic engagement and organizations within the community.
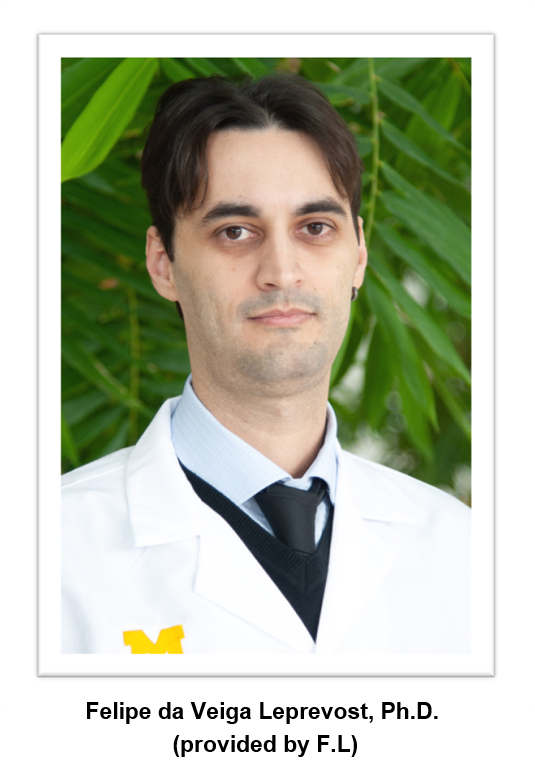
Felipe da Veiga Leprevost, Ph.D. 
Research Investigator at the University of Michigan with Dr. Alexey Nesvizhskii. He holds a M.S in Cellular & Molecular Biology and a Ph.D. in Bioinformatics from Fiocruz in Brazil and works on computational proteomics for the CPTAC program.
IS: What are your main responsibilities in computational proteogenomics?
Felipe da Veiga Leprevost (FVP): As a member of the CPTAC consortium my main responsibility is to keep our proteomics data analysis pipeline up and running, making sure that it will perform in the best way possible when processing different cohorts. Our pipeline is composed of three different software tools created by our group: MSFragger is responsible for the fast database search, Philosopher performs the post-processing filtering and quantification and TMT-Integrator applies statistical filtering to the combined reports. I’m also responsible for developing and maintaining analysis tools like Philosopher.
IS: What types of computational tools and services do you provide for the Michigan Medical Community?
FVP: At the University of Michigan we collaborate with groups dedicated to basic and clinical research which means we need to be prepared to provide different solutions depending on the project they have. For shotgun data-dependent analysis (DDA) we are able to generate the best results when using our pipeline; we also developed data-independent analysis (DIA)-Umpire for DIA analysis and REPRINT (Resource for Evaluation of Protein Interaction Networks) for protein interaction networks. We also conduct comparative and functional analyses aiding with the data interpretation in order to cover all aspects of a proteomics-based project.
IS: You are a native of Brazil. What is your favorite part about the culture?
FVP: The best thing about Brazil is the people, everyone is very friendly. We have a huge blend of culture and traditions from different places and countries.
Francesca Petralia, Ph.D. 
Assistant Professor at the Institute for Genomics and Molecular Biology at the Ichan School of Medicine at Mt. Sinai, New York and is part of Dr. Pei Wang's group. She earned her Ph.D. in statistics from Duke University and develops computational methods for the CPTAC program.
IS: What types of computational methods have you developed since being at Mt. Sinai?
Francesca Petralia (FP): At Mt. Sinai, I analyze multi-omics data and develop statistical tools that integrate information from existing databases and borrow information across different data types. This helps estimate high dimensional networks, or networks with many associations, which can be difficult when handling multi-omics data. To remedy this I perform a joint analysis; this method increases the power and reduces false positives in our studies when examining these associations. Such complex high-dimensional networks can cast light on the interaction across genes/proteins and improve our understanding on the complex protein-protein interactions underlying cancer.
IS: How have these methods contributed to the recent CPTAC ccRCC study?
FP: In the ccRCC study my network tool was utilized to identify biological processes activated at the post-translational modification (PTM) level. PTMs play a crucial role in cancer development and CPTAC efforts measure this type of data large-scale in different cancer types for the first time. Through my network analysis we identified multiple signal transduction pathways activated in tumors and provided evidence for expanding treatment selection beyond current FDA-approved therapies. We also utilized my published algorithm TSNet for tumor purity when comparing differentially expressed proteins in tumors versus adjacent normal tissue.
IS: A hobby of yours is photography. What is your process for getting the perfect shot?
FP: Lots of patience and good light! Morning light is usually best, when the air is still and the lighting soft.
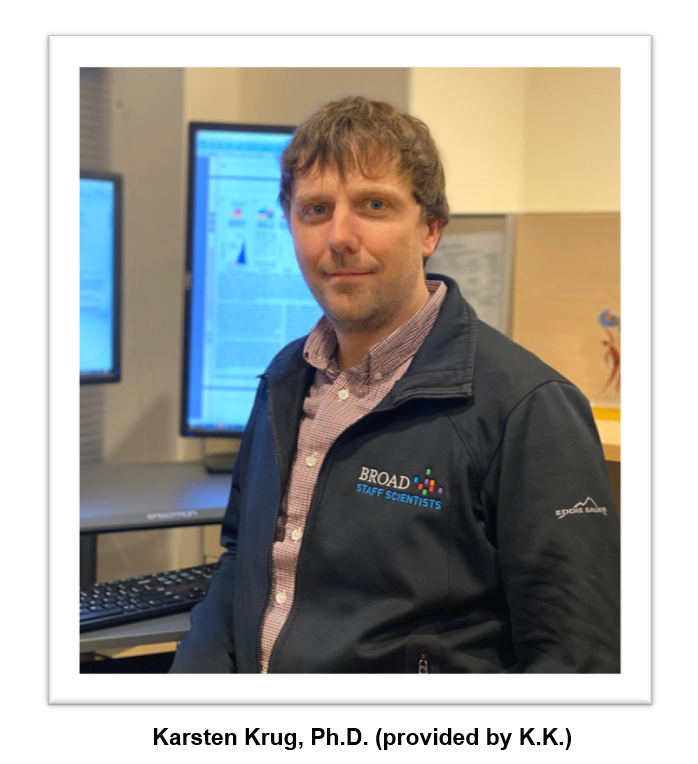
Karsten Krug, Ph.D. 
Computational scientist in the Proteomics Platform at the Broad Institute with Dr. D.R. Mani's group. He holds a Ph.D. in Biology from the Proteome Center in Tuebingen, Germany and works on proteomics-based tool development in the CPTAC program.
IS: The methods you’ve developed for the CPTAC program involve integration of multi-omics data into one place, such as PANOPLY. How does this work?
Karsten Krug (KK): Integrating data from multiple platforms like genome mutations, RNA expression, protein expression and post-translational modifications, typically acquired in different laboratories, requires careful data curation. First, the data must be made comparable to each other, or harmonized, which often requires additional normalization or transformation steps. Then, this data can be centrally analyzed using cloud infrastructure. PANOPLY presents a suite of tools for multi-omics data analysis running on the Broad Institute’s Terra cloud environment. In PANOPLY we can perform analyses ranging from quality control to correlating copy number aberrations to protein expression and phosphoprotein signaling. We’ve also included a new module to perform molecular subtyping. Using multi-omics data, including proteomics and PTMs, we can now derive a more comprehensive picture of the molecular processes defining different tumor types.
IS: Tools generated within the consortium are used by the broader scientific community. How does the toolkit Protigy enable non-computational scientists explore data generated?
KK: I developed Protigy to streamline tasks of laboratory scientists that generate lots of data but don’t have the time or motivation to learn R or Python required to analyze their datasets. Protigy runs in a web browser so no programming skills are needed. During implementation feedback from my non-computational colleagues helped me to tailor the application to routine laboratory analyses. Protigy enables the user to intuitively browse through a dataset, examine quality control metrics and apply standard statistical tests to compare different experimental conditions mainly due to the computational framework it runs on. Results can then be downloaded, shared with collaborators, or used to prepare manuscript figures.
IS: What is your favorite thing to do outside of the lab?
KK: I love the adrenaline rush while blasting down the trails in Highland Mountain Bike Park in New Hampshire!
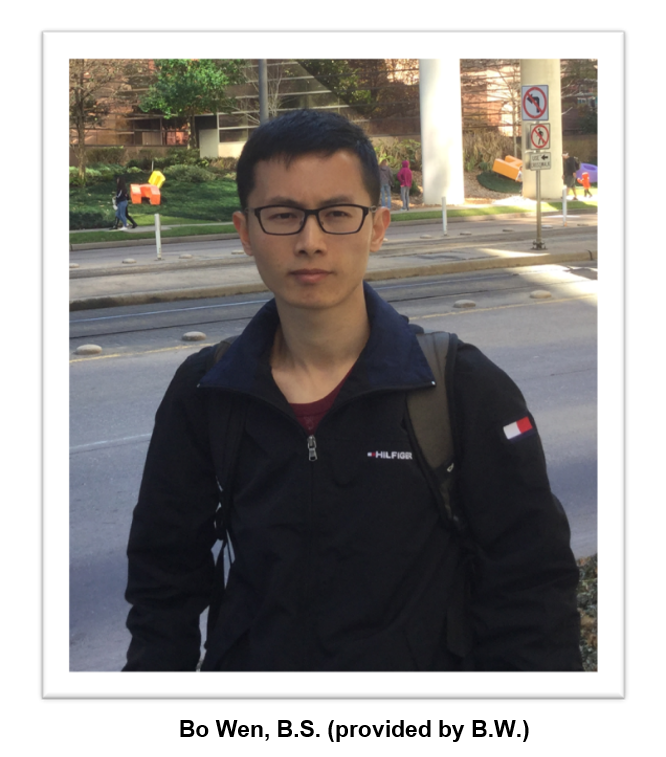
Bo Wen, B.S. 
Senior bioinformatics programmer at the Baylor College of Medicine in Bing Zhang's group. He earned his Bachelor of Science in Bioinformatics from Huazhong University of Science and Technology in China.
IS: What software tools have you developed for the CPTAC program?
Bo Wen (BW): CPTAC uses an integrated proteogenomics strategy that generates large datasets requiring novel tools and algorithms for analysis. My work focuses on data quality control and proteogenomics-based variant peptide and neoantigen identification. Three tools, PDV, OmicsEV and AutoRT (described below) were designed to address quality control. PDV evaluates the quality of peptide identification by interactively visualizing peptide spectrum matches and OmicsEV allows users to compare and evaluate different data matrices generated from the same omics dataset and includes more than 20 evaluation metrics. Evaluation results are in HTML format to identify the optimal analysis method for the omics dataset under investigation. For proteomics based variant peptide and neoantigen identification, PepQuery and NeoFlow were developed. PepQuery is a peptide-centric search engine with high sensitivity and specificity. NeoFlow is a discovery pipeline utilizing genomics and proteomics data. These tools have been applied to the colon and ccRCC studies, among others.
IS: One tool, AutoRT, is described as ‘deep learning-based retention time prediction’. What does that mean and how does it work?
BW: AutoRT is a tool for peptide retention time prediction using cutting edge deep learning technology. In liquid chromatography-tandem mass spectrometry experiments, peptides elute from the LC column over time. The time each peptide elutes is recorded by the instrument as the retention time and is an intrinsic feature of the peptide. In AutoRT we leveraged the power of automated deep learning to predict peptide retention times with high accuracy based on peptide sequences. The deep neural networks implemented in AutoRT were automatically designed using a neural architecture search algorithm and can characterize peptide sequences and accurately perform prediction. Additionally, AutoRT has been shown to outperform conventional methods using CPTAC datasets. We’re using AutoRT predicted retention time to improve the sensitivity and confidence of peptide identification in immunopeptidomics and a new tool called DeepRescore implementing this function will be released this year.
IS: Where do you like to go fishing? What was your biggest catch?
BW: I usually go fishing at Seawolf Park at Galveston’s Pelican Island near Houston, Texas. A few of my friends also like fishing; we often go together and it’s really fun. My biggest catch was a five-pound spadefish on a deep sea fishing trip. My favorite moment is to share the catch with friends who may not enjoy fishing, but like fresh seafood.

